Research Report 9 - Pilot Project on Informality in Port Adelaide: Appendix B
	
    Updated: 30 May 2013


              Appendix B Port Adelaide Divisional Profile and Map
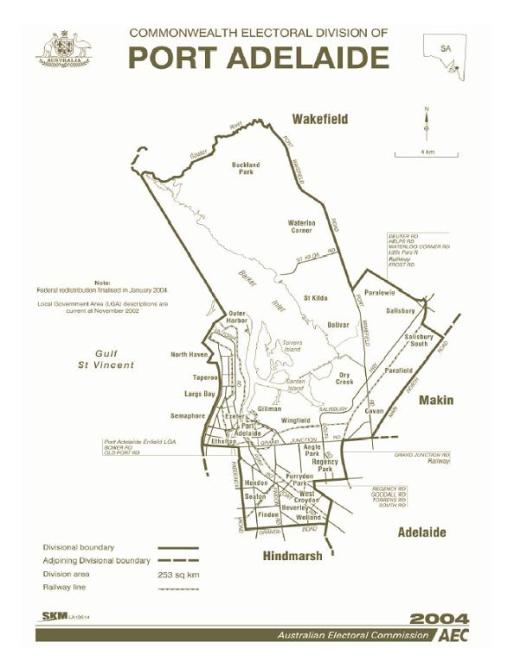
              Figure 2: Electoral Map of Port Adelaide
               
              
              Port Adelaide Divisional Profile
              
                
                  | Demographic Rating | Outer Metropolitan | 
                
                  | Seat Status | Safe Labor | 
                
                  | Socio-Economic Status [14] | Low | 


              2004 federal election
              
                
                  | Enrolment | 97 707 | 
                
                  | Turnout | 94.34% | 
                
                  | Two Candidate Preferred Vote | ALP 62.91% LP 37.09% | 
                
                  | Informal Vote | 7.08 % | 


              - The Socio Economic Index is explained in Research Report 5 – Analysis of Electoral Divisions, produced by the Australian Electoral Commission. The Index is supplied by the Australian Bureau of Statistics and is a general measure of an areas social and economic well-being.