Proposed redistribution of New South Wales into electoral divisions
Updated: 14 October 2015
Chapter 1 Background and context
This chapter outlines the legislative requirements of the redistribution, ranging from the commencement of the process to the release of the Committee’s proposed redistribution. The chapter explains how these requirements were met during the redistribution process, and also discusses relevant information about population and enrolment in New South Wales.
A redistribution is a redrawing of electoral boundaries to ensure, as near as practicable:
each state and territory gains representation in the House of Representatives in proportion to its population, and
there are a similar number of electors in each electoral division for a given state or territory.
Compliance with legislative requirements
The Commonwealth Electoral Act 1918 (the Electoral Act) specifies that a redistribution process should be undertaken when:
the number of members in the House of Representatives to which a state or territory is entitled has changed (relative population change),
the number of electors in more than one third of the electoral divisions in a state (or one of the electoral divisions in the Australian Capital Territory or the Northern Territory) deviates from the average divisional enrolment by over ten per cent for a period of more than two months, or
a period of seven years has elapsed since the last redistribution process was determined.
The processes to be followed in conducting a redistribution process are also specified in the Electoral Act. Appendix B summarises the legislative requirements which have been followed in conducting this redistribution. Each of these requirements is discussed in further detail in this chapter.
Determination of the number of members of the House of Representatives to be chosen in states and territories
On 13 November 2014, the then acting Electoral Commissioner made a determination under sub-section 48(1) of the Electoral Act of the number of members of the House of Representatives to which each state and territory is entitled at the next federal election.
As a result of this determination, New South Wales’ entitlement decreased from 48 to 47 members of the House of Representatives.
Direction for a redistribution of New South Wales electoral divisions
In accordance with sub-section 59(1) of the Electoral Act, the Electoral Commission published a notice in Commonwealth Government Notices Gazette (the Gazette) on 1 December 2014 directing that a redistribution commence for New South Wales.
Projection time for equality of enrolments
Section 63A of the Electoral Act establishes that the projection time in relation to a redistribution process is the end of the period three years and six months after the ‘starting time’. The starting time from which the projection time is calculated, as defined by sub-section 63A(5), is the date on which the augmented Electoral Commission for New South Wales determines the boundaries and names of electoral divisions via publication of a notice in the Gazette.
The starting time for the redistribution of New South Wales is 25 February 2016 as this is the date when the augmented Electoral Commission will cause the boundaries and names of electoral divisions in New South Wales to be published in the Gazette.
On 1 December 2014, the Electoral Commission noted that the projection time for New South Wales is 25 August 2019.
Current enrolment quota
Section 65 of the Electoral Act requires the Electoral Commissioner, as soon as practicable after the redistribution process commences, to determine the current enrolment quota or average divisional enrolment using the following formula:
In calculating this quota, sub-section 65(2) of the Electoral Act provides that:
where the result is less than 0.5, the number is rounded down to the nearest whole number; or
where the result is equal to or greater than 0.5, the number is rounded up to the nearest whole number.
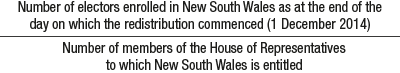
Table A shows the numbers used to calculate the current enrolment quota and the resultant range of the permissible maximum and minimum number of electors in an electoral division (discussed further in ‘Statutory requirements for the making of a proposed redistribution’).
Table A: Current enrolment quota and permissible range for New South Wales
Number of electors enrolled in New South Wales as at the end of the day on which the redistribution commenced (1 December 2014)
4 863 593
Number of Members of the House of Representatives to which New South Wales is entitled
47
Current enrolment quota for New South Wales
103 481
Permissible maximum number of electors in an electoral division(current enrolment quota + 10 per cent)
113 829
Permissible minimum number of electors in an electoral division(current enrolment quota – 10 per cent)
93 132
The then acting Electoral Commissioner signed a written instrument on 8 December 2014, as required by sub-section 68(1) of the Electoral Act, determining the quota of electors for the purposes of the redistribution to be 103 481.
As discussed in Appendix C, when making a proposed redistribution, the Committee is required to ensure, that the current number of electors in a proposed electoral division does not vary by more than or less than 10 per cent from the current enrolment quota.
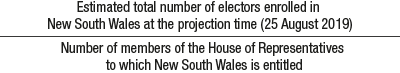
Enrolment projections and projected enrolment quota
As discussed in Appendix C, when making a proposed redistribution, the Committee is required by sub-section 66(3)(a) of the Electoral Act to ensure, as far as practicable, that the number of electors enrolled in the proposed electoral division at the projection time will not vary by more than 3.5 per cent above or more than 3.5 per cent below the projected enrolment quota. This quota is calculated using the following formula:
Table B shows the figures used to calculate the projected enrolment quota and the resultant range of the permissible maximum and minimum number of electors in an electoral division at the projection time (discussed further in ‘Statutory requirements for the making of a proposed redistribution’).
Table B: Projected enrolment quota and permissible range for New South Wales
Estimated total number of electors enrolled in New South Wales at the projection time (25 August 2019)
5 195 490
Number of Members of the House of Representatives to which New South Wales is entitled
47
Projected enrolment quota for New South Wales
110 542
Permissible maximum number of electors in an electoral division at the projection time (projected enrolment quota + 3.5 per cent)
114 411
Permissible minimum number of electors in an electoral division at the projection time (projected enrolment quota – 3.5 per cent)
106 673
Appointment of the Redistribution Committee for New South Wales
Sub-section 60(1) of the Electoral Act specifies that a Redistribution Committee for New South Wales is required to be appointed by the Electoral Commission, via a written instrument, as soon as practicable after the commencement of the redistribution process. Section 60 also specifies the membership of the Redistribution Committee.
The membership of the Redistribution Committee for New South Wales is provided at Table C.
Table C: Membership of the Redistribution Committee for New South Wales
Position on Redistribution Committee
Name
Basis for membership
Chair
Mr Tom Rogers
Electoral Commissioner
Member
Mr Doug Orr
Australian Electoral Officer for New South Wales
Member
Mr Des Mooney
Surveyor General for New South Wales
Member
Mr Grant Hehir (until 5 June 2015)
Auditor-General of New South Wales
Mr Tony Whitfield (acting thereafter)
Note: Mr Hehir resigned from the position of Auditor-General of New South Wales prior to the first meeting of the Redistribution Committee.
The Committee met on:
11 June 2015,
18 June 2015,
25 June 2015,
9 July 2015, and
17 July 2015.
Invitation for interested parties to submit suggestions and comments on suggestions
The Electoral Commissioner is required by sub-sections 64(1) and 64(2) of the Electoral Act to invite written suggestions relating to the redistribution and written comments on the suggestions received by:
a notice published in the Gazette on a Wednesday
a notice published in two newspapers circulating throughout New South Wales.
The notice in the Gazette was published on Wednesday 22 April 2015 and notices were published in The Sydney Morning Herald, The Daily Telegraph and The Australian on Saturday 25 April 2015 and in The Land on Thursday 30 April 2015.9 The two newspapers additional to the statutory requirements were utilised to ensure that, as broadly as possible, information about the redistribution was provided throughout New South Wales.
These notices included information about the processes involved in conducting a redistribution, how to participate in the process and where to find further information. Table D indicates the avenues which could be utilised to make a suggestion or comment on a suggestion, and the extent to which these were used.
Table D: Avenues used to make a suggestion or comment on suggestion
Option
Suggestions
Comments on suggestions
Number
Percentage
Number
Percentage
Form upload on AEC website
7
30.43%
64
40.76%
Email
9
39.13%
63
40.13%
Mail
3
13.04%
26
16.56%
Fax
2
8.70%
4
2.55%
In person
2
8.70%
0
0.00%
Total
23
100.00%
157
100.00%
Interested parties were able to submit written suggestions from Wednesday 22 April 2015 until 6pm (AEST) on Friday 22 May 2015, the 5th Friday after publication of the Gazette notice. During this time, 23 suggestions were received by the Committee (see Appendix D).
As required by paragraph 64(3)(a) of the Electoral Act, copies of these suggestions were made available to members of the public for perusal at the office of the Australian Electoral Officer for New South Wales in Sydney from Monday 25 May 2015. The suggestions were also made available on the Australian Electoral Commission (AEC) website from this date.
Interested parties were able to submit written comments on suggestions from Monday 25 May 2015 until 6pm (AEST) on Friday 5 June 2015, the 7th Friday after publication of the Gazette notice. During this time, 157 comments on suggestions were received by the Committee (see Appendix E).
From 9 June 2015, interested parties were able to view these comments on suggestions on the AEC website and at the office of the Australian Electoral Officer for New South Wales in Sydney.
Committee’s consideration of suggestions and comments on suggestions
The Committee is required by sub-section 64(4) to consider all suggestions and comments on suggestions which were received by the specified lodgement times.
In formulating its proposed redistribution of New South Wales, the Committee considered each of the 23 suggestions and 157 comments on suggestions.
Appendix F outlines the key themes contained in these suggestions and comments on suggestions, and how the Committee responded to them, having regard to the requirements of the Electoral Act.
Statutory requirements for the making of a proposed redistribution
Section 66 of the Electoral Act required the Committee to adhere to specific criteria in forming the proposed boundaries.
The Committee ensured that the number of electors in each proposed New South Wales electoral division would:
not be less than 90 per cent or more than 110 per cent of the current divisional enrolment (see Table A for the permissible minimum and maximum number of electors at this time); and
not be less than 96.5 per cent or more than 103.5 per cent of the average projected divisional enrolment at the projection time of 25 August 2019 (see Table B for the permissible minimum and maximum number of electors at this time).
The Committee also gave due consideration to:
community of interests in the proposed electoral divisions including economic, social and regional interests;
means of communication and travel in the proposed electoral division;
the physical features and area of the proposed electoral divisions; and
the boundaries of existing electoral divisions.
Further details regarding these requirements are in Appendix C.
Appendix G outlines the mechanics of constructing proposed electoral divisions.
Population and enrolment in New South Wales
As previously mentioned, the periodic redrawing of electoral boundaries is required to:
address changes in the population of a state or territory, which may result from natural increase, natural decrease, net overseas migration or net interstate migration, and/or
address changes in the distribution of electors in the state or territory.
The population of New South Wales
On 13 November 2014, the then acting Electoral Commissioner ascertained New South Wales’ population was 7 500 617.10 This represents growth of 3.14 per cent in population since the previous ascertainment of the population on 29 September 2011.
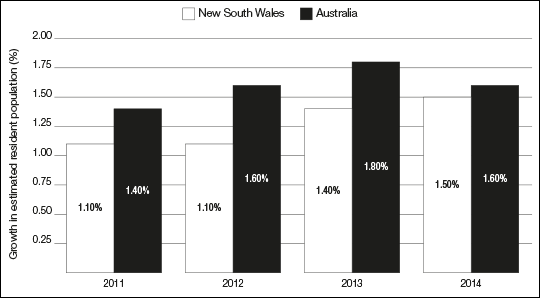
Similarly, Figure A shows the estimated resident population of New South Wales has grown annually over this period.1112 From Figure A, it is also evident that:
growth of the estimated resident population of New South Wales was at a slower rate than the estimated resident population of Australia during this period, and
growth of the estimated resident population of New South Wales has increased in the 12 months between 30 June 2013 and 30 June 2014, the ABS commenting that the increase between 2013 and 2014 was the largest population increase of any state or territory.13
Figure A: Growth of estimated resident population of New South Wales and Australia in the 12 months to 30 June, 2011 to 2014
Source:
ABS, 3218.0 – Regional Population Growth, Australia, 2010–11
ABS, 3218.0 – Regional Population Growth, Australia, 2011–12
ABS, 3218.0 – Regional Population Growth, Australia, 2012–13
ABS, 3218.0 – Regional Population Growth, Australia, 2013–14
Where is population growth in New South Wales located?
ABS analysis shows that, at June 2014, just under two thirds of New South Wales’ population (some 4.84 million people) lived in Greater Sydney, with population growth in this area accounting for 77 per cent of the state’s total growth in 2013–14.14
During 2013–14, the ten areas with the largest population increases in New South Wales were all located within Greater Sydney, as were eight of the ten fastest growing areas in New South Wales. In contrast, those areas which are predominantly rural are experiencing declining population.15
The population density of New South Wales at June 2014 was 9.4 people per square kilometre (sq km); with the population density in Greater Sydney being 390 people per sq km. Eight of the ten most densely populated areas in Australia were located in Greater Sydney, with the top four located around Sydney’s central business district.16
The ABS has observed that, between 2004 and 2014, the centre of population in New South Wales has moved three kilometres south-east, reflecting strong population growth in Greater Sydney and along the New South Wales coast.17
Enrolment in New South Wales
When the redistribution of New South Wales commenced on 1 December 2014, 4 863 593 electors were enrolled to vote. By the projection time of 25 August 2019, it is projected that the size of the federal electoral roll for New South Wales would have grown by 6.82 per cent to 5 195 490 electors.
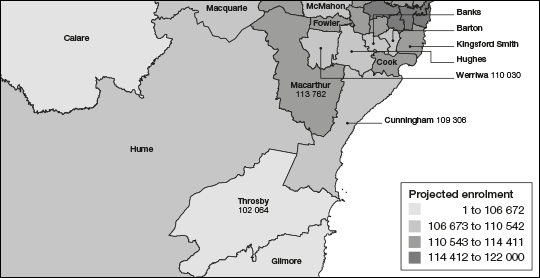
From Table E, it is apparent that while all current electoral divisions are expected to grow in the period 1 December 2014 to 25 August 2019, the level of growth is not consistent across the state. Projected growth varies considerably, ranging from 1.17 per cent for the Division of Lyne to 12.49 per cent for the Division of Macarthur.
Table E: Summary of current electoral divisions
Existing electoral division
Current enrolment as at 1 December 2014
Projected enrolment as at 25 August 2019
Projected growth
Number
Percentage variation from quota: 103 481
Number
Percentage variation from quota: 110 542
Banks
101 518
-1.90%
109 653
-0.80%
8.01%
Barton
99 485
-3.86%
108 883
-1.50%
9.45%
Bennelong
102 693
-0.76%
110 876
0.30%
7.97%
Berowra
96 877
-6.38%
104 006
-5.91%
7.36%
Blaxland
102 155
-1.28%
112 764
2.01%
10.39%
Bradfield
100 433
-2.95%
107 952
-2.34%
7.49%
Calare
102 513
-0.94%
106 573
-3.59%
3.96%
Charlton
99 730
-3.62%
103 128
-6.71%
3.41%
Chifley
104 866
1.34%
116 049
4.98%
10.66%
Cook
104 570
1.05%
112 358
1.64%
7.45%
Cowper
98 462
-4.85%
100 289
-9.28%
1.86%
Cunningham
105 374
1.83%
109 306
-1.12%
3.73%
Dobell
99 453
-3.89%
106 391
-3.76%
6.98%
Eden-Monaro
101 113
-2.29%
104 154
-5.78%
3.01%
Farrer
94 395
-8.78%
97 030
-12.22%
2.79%
Fowler
101 123
-2.28%
110 903
0.33%
9.67%
Gilmore
103 318
-0.16%
105 336
-4.71%
1.95%
Grayndler
105 999
2.43%
115 074
4.10%
8.56%
Greenway
103 751
0.26%
115 990
4.93%
11.80%
Hughes
101 987
-1.44%
109 987
-0.50%
7.84%
Hume
102 706
-0.75%
107 397
-2.85%
4.57%
Hunter
99 080
-4.25%
103 863
-6.04%
4.83%
Kingsford Smith
103 736
0.25%
112 719
1.97%
8.66%
Lindsay
102 005
-1.43%
112 273
1.57%
10.07%
Lyne
98 245
-5.06%
99 398
-10.08%
1.17%
Macarthur
101 129
-2.27%
113 762
2.91%
12.49%
Mackellar
104 264
0.76%
111 364
0.74%
6.81%
Macquarie
99 516
-3.83%
106 949
-3.25%
7.47%
McMahon
99 957
-3.41%
108 421
-1.92%
8.47%
Mitchell
98 903
-4.42%
108 181
-2.14%
9.38%
Newcastle
97 881
-5.41%
100 999
-8.63%
3.19%
New England
102 196
-1.24%
105 155
-4.87%
2.90%
North Sydney
102 583
-0.87%
111 877
1.21%
9.06%
Page
95 983
-7.25%
98 008
-11.34%
2.11%
Parkes
102 326
-1.12%
106 222
-3.91%
3.81%
Parramatta
99 678
-3.68%
111 676
1.03%
12.04%
Paterson
97 472
-5.81%
99 749
-9.76%
2.34%
Reid
106 118
2.55%
118 126
6.86%
11.31%
Richmond
98 445
-4.87%
100 573
-9.02%
2.16%
Riverina
100 129
-3.24%
104 513
-5.45%
4.38%
Robertson
101 668
-1.75%
107 722
-2.55%
5.95%
Shortland
96 950
-6.31%
100 571
-9.02%
3.73%
Sydney
108 386
4.74%
121 219
9.66%
11.84%
Throsby
99 315
-4.03%
102 064
-7.67%
2.77%
Warringah
104 002
0.50%
113 787
2.94%
9.41%
Watson
102 299
-1.14%
112 429
1.71%
9.90%
Wentworth
110 870
7.14%
119 741
8.32%
8.00%
Werriwa
97 936
-5.36%
110 030
-0.46%
12.35%
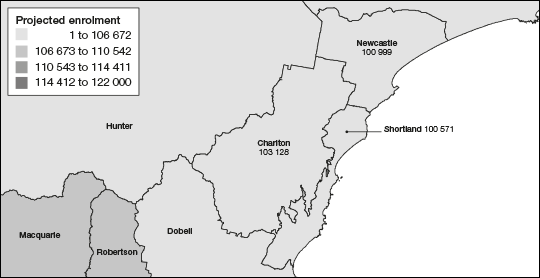
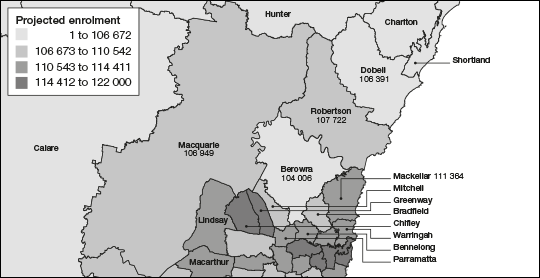
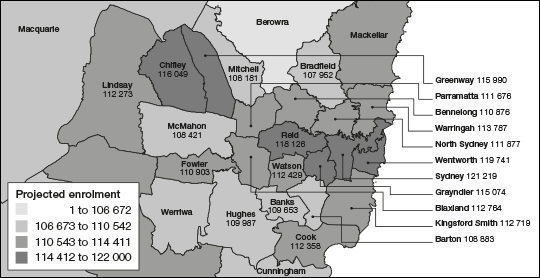
Note: Shading indicates where current or projected enrolment is outside the permissible range.
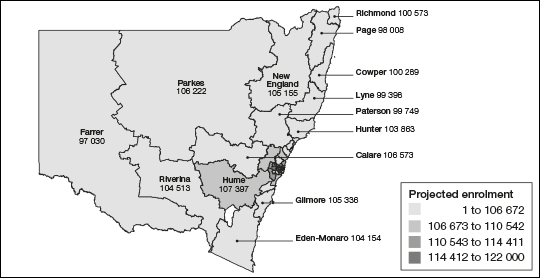
The extent to which projected enrolment is concentrated in diverse regions is illustrated in Figures B to F.
Figure B: Projected enrolment as at 25 August 2019 for existing electoral divisions – rural New South Wales
Figure C: Projected enrolment as at 25 August 2019 for existing electoral divisions – Cunningham, Macarthur, Throsby and Werriwa
Figure D: Projected enrolment as at 25 August 2019 for existing Divisions of Charlton, Newcastle and Shortland
Figure E: Projected enrolment as at 25 August 2019 for existing Divisions of Berowra, Dobell, Mackellar, Macquarie and Robertson
Figure F: Projected enrolment as at 25 August 2019 for existing electoral divisions – Metropolitan region
This variation in projected enrolment growth is more apparent when considering electoral divisions by demographic classification:
of the ten electoral divisions with the lowest levels of projected growth, nine are classified as rural and one is classified as provincial,
of the ten electoral divisions with the highest levels of projected growth, five are classified as inner metropolitan and five are classified as outer metropolitan, and
the 14 rural electoral divisions in New South Wales and five of the eight provincial electoral divisions occupy positions 30 to 48 when projected growth is ranked in descending order.
Further analysis of projected enrolment reveals that 23 of the existing electoral divisions are within 3.5 per cent of the enrolment quota as required by section 66 of the Electoral Act.
The remaining 25 electoral divisions are outside 3.5 per cent of the projected enrolment quota.
Six of these 25 electoral divisions are above the maximum permissible 3.5 per cent of the enrolment quota and need to transfer electors. Four of these six electoral divisions are classified as inner metropolitan and two are classified as outer metropolitan.
Nineteen electoral divisions are below the minimum 3.5 per cent of the enrolment quota and need to gain electors. Of these electoral divisions, 13 are classified as rural, five as provincial and one as outer metropolitan.
These variations are not unexpected given the trends in population growth in New South Wales.
This analysis highlights the need for the Committee to make significant changes to the existing electoral boundaries. The need for boundary modification is caused by the requirement to remove an electoral division which, of itself, generates significant consequential changes to existing electoral divisions, with all electoral divisions potentially affected.
Sub-section 64(2) of the Electoral Act notes that the newspaper notices do not need to be published on the same day as the Gazette notice.
This ascertainment was made using statistics supplied to the then acting Electoral Commissioner by the then acting Australian Statistician on 22 October 2014 in accordance with section 47 of the Electoral Act and published in Table 8 of 3101.0 – Australian Demographics Statistics, March 2014 on 25 September 2014.
Estimated resident population is the ABS official estimate of the Australian population, which links people to a place of usual residence in Australia. Usual residence in Australia refers to that address at which the person has lived or intends to live for six months or more in a given reference year. Estimates of the resident population are based on Census counts by place of usual residence (excluding short-term overseas visitors in Australia), with an allowance for Census net undercount, to which are added the estimated number of Australian residents temporarily overseas at the time of the Census. For further information, see the explanatory notes in 3218.0 – Regional Population Growth, Australia, 2013–14, available at: www.abs.gov.au
Please note that the estimated resident population differs from the population ascertained on 13 November 2014.
ABS, 3218.0 – Regional Population Growth, Australia, 2013–14
ibid
ibid
ibid
ABS, 3218.0 – Regional Population Growth, Australia, 2013–14