Australian Electoral Commission


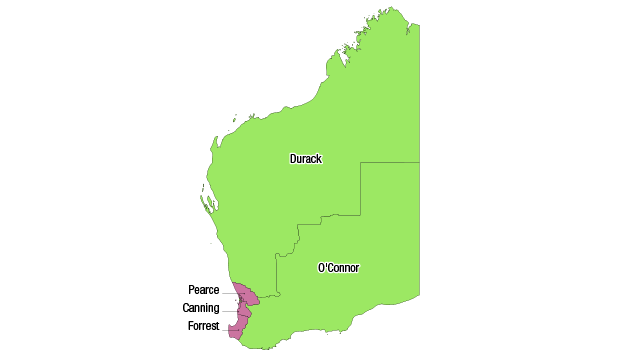
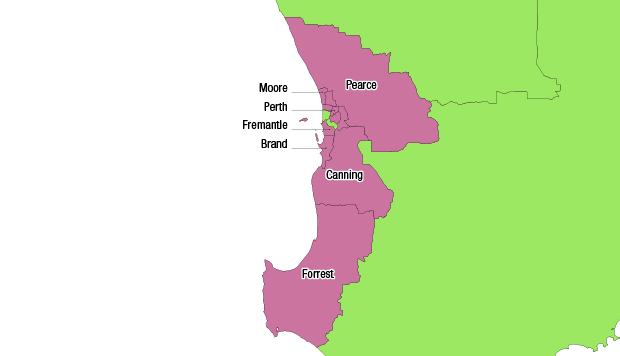
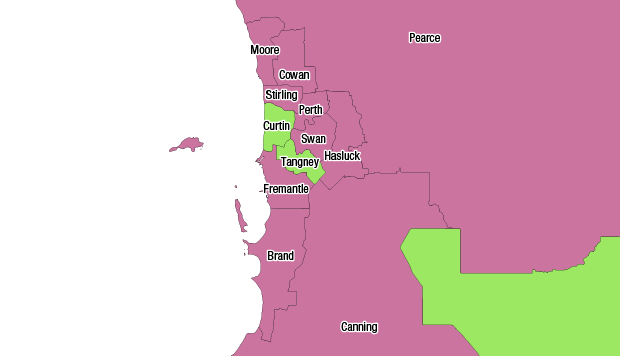
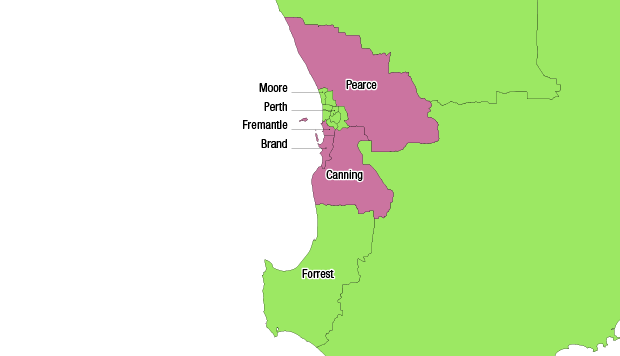
Maps illustrating how the enrolment of each division in Western Australia as at 1 December 2014 relates to the current enrolment quota.
Current enrolment key
Pink – over variance (103 429+)
Green – within variance (84 623 to 103 428)
Yellow – under variance (0 to 84 622)
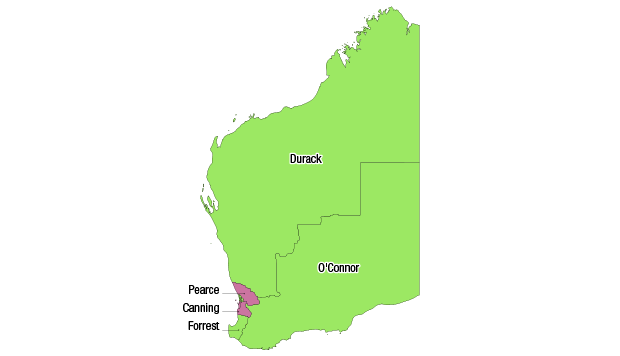
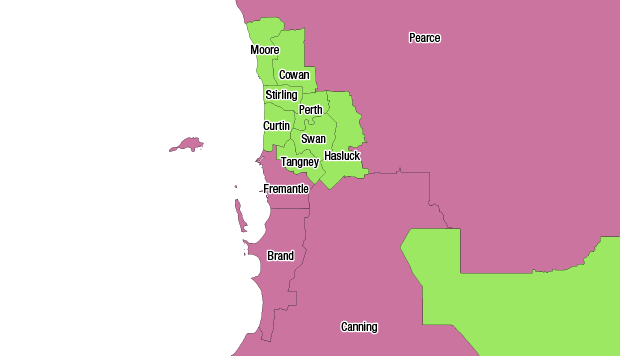
Maps illustrating how the projected enrolment of each division in Western Australia (as at the projection date of 8 February 2017) relates to the projected enrolment quota.
Projected enrolment key
Pink – over variance (103 176+)
Green – within variance (96 197 to 103 175)
Yellow – under variance (0 to 96 196)
